
A VRML 2.0-compliant web browser is required in order to view the data plots. These displays have been tested and found compliant with Cosmo Player 1.02 for IRIX and 2.0 for Windows 95/NT.
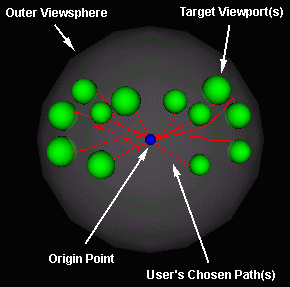
The plots represent the "outer viewsphere," or the sphere to which user movement is constrained, as a grey sphere, initially occupying the centre of the viewing area. Twelve trials are represented on each plot, comprising the twelve trials presented (in random order) during each block. Each plot, then, represents the full data for a single block. The small green spheres dotting the surface of the outer viewsphere represent the target viewports. Upon arrival within the target viewport (for that trial) the task is considered complete. The radii of the green spheres represent the size of the viewport for the associated trials. The small blue sphere roughly centred in the initial viewing area, on the surface of the outer viewphere, represents the starting point, or the initial user position on the outer viewsphere at the beginning of each trial. Each red line represents one path which the user followed to move from their initial position to target acquisition for one trial.
This information is summarized in Figure 1 below (please note that on some browsers, palette selection may cause the grey 'outer viewsphere' to be too dark to be seen against the black background in this sample plot -- in general this will be corrected when viewing the actual plots in your VRML browser) :

The following table gives access to the entire data set as recorded during the experiment. The 12 columns represent the 12 subjects, divided into those subjects in Group A (Head-as-Head) and those subjects in Group B (Head-as-Hand). The 80 rows represent the 80 blocks, divided into those blocks in session 1 (representing initial response to the task) and those blocks in session 2 (representing performance after 48 hours away from the task).
Page design by Irfan-Kim Ahmad, December 1997. Last updated by Stephanie Spence, June 1999.