 Typing
Digit
Classifier
Typing
Digit
ClassifierCISC 859 Pattern Recognition, Fall 2004 (Queen's University)
Typing
Digit
Classifier
CISC 859 Pattern Recognition, Fall 2004 (Queen's
University)
This Digit Classifier is primarily designed to satisfy the course project requirement of CISC 859 Pattern Recognition, instructed by Prof. Dorothea Blostein.
The program only takes care of the typing digits. Different classification methods may be applied here. The program is coded by Henry Xiao. And no guarantee is provided for using the program. Since there is a large memory requirement for image processing, memory may be a problem when running the program. The program has not been tested for thread safe yet. Primarily, the working image should not be bigger than 500x500. If you find serious problems running this program, please send Henry a mail, and we will try to fix it.
The source code is basically provided except the classifier classes. Please see downloads section for releases. And of course, you are welcome to try it out and let me know your preferences.
Based on the project requirement, the program is constructed in two parts. The first part is to implement image processing methods such as grey-scale the image, black-white the image based on certain threshold etc. The other part works on the classification methods to classify the typing digits.
We intend to create a GUI for the program interface here to make the image processing and classification results visible through out the program itself. The program is implemented using Java. Java 1.4.x is required to run some image processing functions. The program restricts the image format to be .gif or .jpg (lower case for extension please). User can further modify the program to accept .png image files without any significant recoding.
The program also allows the user to generate different image files containing typing digits and characters in different font settings (see Function Tutorials for details). The image files are in .jpg format and have the size of 260x240. Notice that the available font types may vary from system to system. The font type set is generated by the operation system, not the program. And the font size set is limited to selections provided by the program since either too small, or too large of the typing digit or character may cause the recognizing problem which is out the scope of this project.
Two parts of functions are discussed here with the first part being the image processing, and the other being the classification.
☼Image Processing Functions:
The Interface
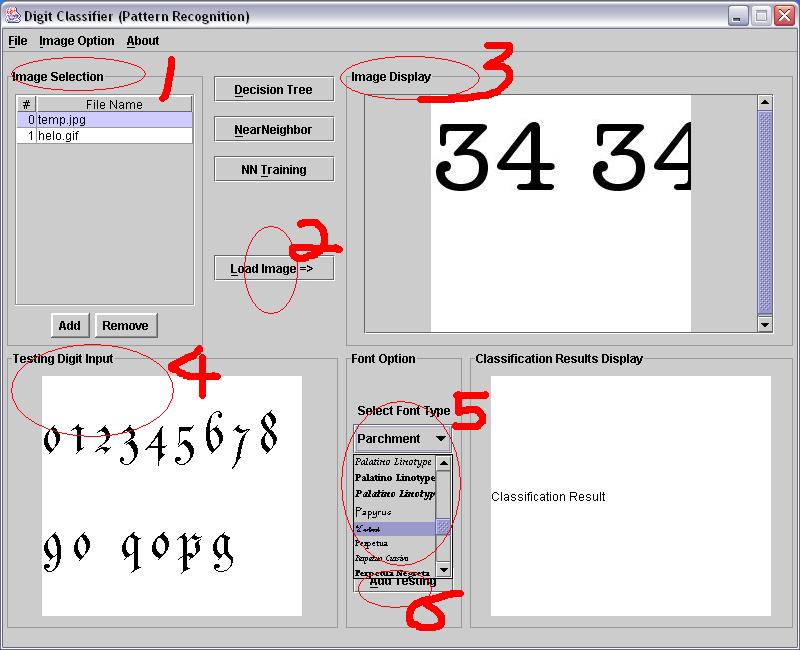 Click image for full size screen shot.
| Instruction Number | Instruction Comments |
| 1 | The panel allows you to add and delete image files either from a directory or a specific file path. Note that if you choose to add from a directory, the selected directory as well as the subdirectories will be searched for image files. The image files have to be in .gif or .jpg format in order to be added into the table. Other format file will be discarded. |
| 2 | Once you select an image file in 1 (highlighted), push the button at 2 will cause the image to be displayed at 3. If no file is selected, the action will result a warning message dialog. |
| 3 | The image display is achieved by using a JLabel object which is the easiest approach. However, implement a MediaTrack here may help if you want the program to be more efficient in graphic processing. |
| 4 | The panel allows you to input the digits
and characters of the selected font type and size. It is basically a
JTextArea object. The size is 260x240, which is also the size of saving
images. The image print function directly saves the JTextArea
component to a .jpg image file. It can be implemented differently to
get over the size limitation. (release 1)* The reimplementation uses the JTextPane class, new features are available through the JTextPane in Java. (release 2)** |
| 5* | The combo box lists all the fonts available in your system. The font names are rendered using that font type so that you can eyeball the font through the list. The loading of the font types can have some significant delay. |
| 6* | The combo box lists all available font sizes. We only allow a set of selections from 18 to 200 to make sure the font size never gets too small for recognizing, or gets too large for saving. |
* for the font type and size selections, each action will impact all the contents of the JTextArea at 4, which mean the current contents (digits and characters) will be all rendered with the selected font type and font size. If you prefer the impact to be afterward, the JTextArea properties need to be reset.
** I take back the previous remark about changing JTextArea properties to allow different font settings in one JTextArea object. It happens that the JTextPane class is the right solution. Well, it is not that easy to make it work. If you are interested, please see the Sun Java Tutorial on this subject.
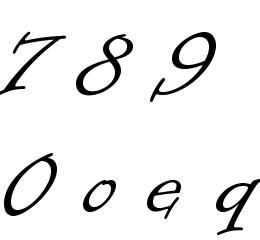
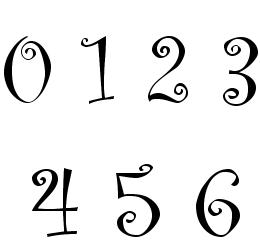
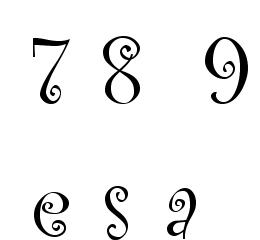
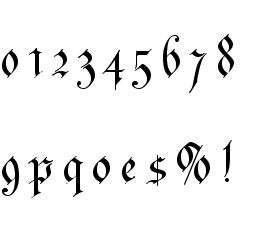
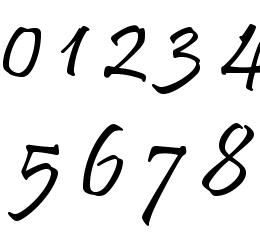
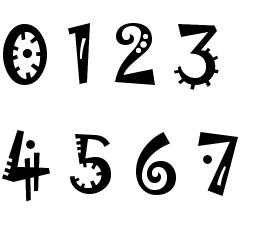
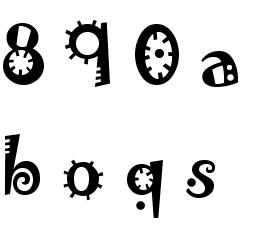
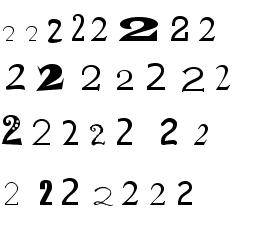
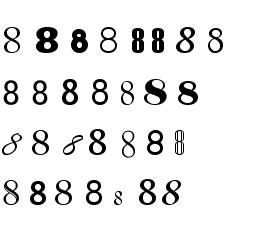
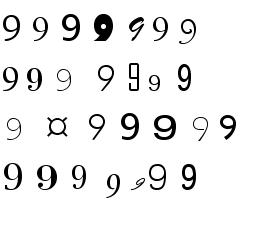
We created some sample image files containing some "funny" font type digits and characters, which happened to screw up some intuitive classification ideas.
|
|
|
 |
| Informal Style 1 | Informal Style 2 | curlzMT style 1 | curlzMT style 2 |
|
|
|
 |
| Parchment Style | Pristina Style | Jokerman 1 | Jokerman 2 |
* I guess the samples are "just for fun". They are more like the handwriting digits and characters which need more sophisticated features to be classified.
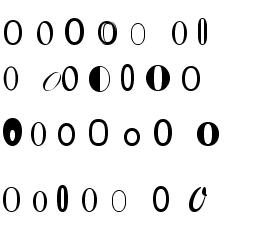
The following examples (kind of wild!) are created using the Random Digit Generator under the File menu. This function is implemented at release 2.
 |
 |
 |
 |
| Random 0's | Random 2's | Random 8's | Random 9's |
Image Processing Functions
| Function Name | Function Comments |
| Black and White | The black and white function makes the
selected image only contains black (valued 0) and white (valued 0xFFFFFF)
pixels in RGB mode. The decision is made by comparing the pixel value (the
average of the red, green, and blue values) with the grey threshold value.
The implementation is through the getPixel() function provided in the ImageIO class from Prof. Dorothea Blostein. It can be done more efficiently with Java BufferedImage class in terms of the memory usage. |
| Find Bound | The find bound function identifies the bounding boxes of the digits and characters in the image. (Not enabled in the first release) |
| 3x3 Blur | The 3x3 blur function makes the selected
image more blur looking by averaging the edges. It is implemented using
Java ConvolveOp class. The 3x3 matrix: {{0.1f, 0.1f, 0.1f}, {0.1f, 0.2f, 0.1f}, {0.1f, 0.1f, 0.1f}} |
| 3x3 Sharpen | The 3x3 sharpen function makes the
selected image edges appearing more clearly. It is implemented using Java
ConvolveOp class. The 3x3 matrix: {{-1.0f, -1.0f, -1.0f}, {-1.0f, 9.0f, -1.0f}, {-1.0f, -1.0f, -1.0f}} |
| 3x3 Edge | The 3x3 edge function makes the selected
image edges appearing wider. It is implemented using Java ConvolveOp
class. The 3x3 matrix: {{-1.f, -1.f, -1.f, -1.f, -1.f}, {-1.f, -1.f, -1.f, -1.f, -1.f}, {-1.f, -1.f, 24.f, -1.f, -1.f}, {-1.f, -1.f, -1.f, -1.f, -1.f}, {-1.f, -1.f, -1.f, -1.f, -1.f}} |
| 5x5 Edge | The 5x5 edge function makes the selected
image edges even wider than the previous one. It is implemented using
Java ConvolveOp class. The 5x5 matrix: {{0.1f, 0.1f, 0.1f}, {0.1f, 0.2f, 0.1f}, {0.1f, 0.1f, 0.1f}} |
| 3x3 Gaussian* | The 3x3 Gaussian function makes the
selected image blur looking by using a Gaussian matrix. It is implemented
using Java ConvolveOp class. The 3x3 matrix: {{1.f, 2.f, 1.f}, {2.f, 4.f, 2.f}, {1.f, 2.f, 1.f}} |
| Random Font Digit | Implemented in release 2 under the File menu. The function allows you to randomly print out digits of a specific number (0-9) with different fonts. The fonts are selected through collection shuffle. |
| another | not implemented |
* I find the Gaussian Blur filter some kind of useful if you want to make your digits or characters appear "low resolution". It could be a way of simulating the scanned digits or characters from the paper works.
☼ Classification Functions:
To be added.
Our first attempt is to measure some "common sense" features of the digits. We list this set of the digit features in the following table.
| Num # | Feature Name | Feature Comments |
| 1 | Hole* | The number of holes in the digit. (i.e. normally an '8' should have two holes) |
| 2 | Up Hole* | The number of holes in the upper part of the digit. (i.e. normally a '9' should have an up hole) |
| 3 | Center Hole | The number of holes in the center of the digit. (i.e. normally a '0' should have a center hole) |
| 4 | Down Hole* | The number of holes in the bottom part of the digit. (i.e. normally a '6' should have a down hole) |
| 5 | Notch | The number of notches in the digit. |
| 6 | Horizontal Line** | The number of the "long" horizontal lines in the digit. (i.e. a '7' is likely to have one horizontal line) |
| 7 | Vertical Line** | The number of the "long" vertical lines in the digit. (i.e. a '4' is likely to have one vertical line) |
| 8 | Pixel Ratio | Given by: # of black pixels / total # of pixels |
| 9 | Bounding Ratio | Given by: # of pixels width / # of pixels height |
| 10 | Hole Ratio | Given by: # of pixels in the hole / total # of pixels |
| 11 | Notch Ratio | Given by: # of pixels in the notch / total # of pixels |
| 12 | Box Width | The bounding box width measured by pixel. |
| 13 | Box Height | The bounding box height measured by pixel. |
* Hole = Up Hole + Center Hole + Down Hole. And the separation ratio between the up part and down part is set to 0.4.
** "long" is measured by a ratio comparing with the box width (horizontal) or box height (vertical). Current setting is 0.8.
Remarks: Feature Set #1 mainly addresses the "common" font type digits. You may find them somehow useless to be applied to those digits that we created using some "wild" fonts in the Function Tutorial section above. So, unless otherwise specifies, we only apply this set of features on the regular font digits. (Click here to find our regular font digit image library).
☼ First Test with Feature Set #1
I finally got the training set done (tired of clicking the mouse for fonts). The set consists of 10 folders. Each folder has 15 image files. Each image file has 10 single digits of different font sizes. One image file uses a font type (i.e. the regular font set has 15 font types). So, for each digit, we have 15 images with each image consisting 10 single digits. Thus, there are 15x10 = 150 instances for a single digit. The training set can be downloaded here.
We primarily use the training set to get the properties of the features. We consider ranking the features based on our training results. This approach shall be very useful for us later to define our decision tree structure. And the Nearest Neighbor (NN) structure can also use the ranking for weighting the features.
We present our results in the following tables and remarks. Our program extracts the features specified in the Feature Set #1 digit by digit reading from an image from the training set. We give an example on how the features getting extracted and printed below.
● Feature Extraction from the program:
| Original Image | Feature Extraction and Print-out |
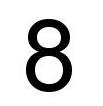 This is a single digit case.
The print out after feature extraction. (the edge pixels are marked with orange, and the hole and notch pixels are marked with blue) |
Width: 46; Height: 73 |
Example remarks: There are two holes detected marked in green. The hole detection is perfect in this case (i.e. this feature is enough to tell us an "8" here). Four notches are marked in blue. The "long" line ratio is 80% in the example. A "long" line is marked in red. We can see that 80% is actually not a very good ratio since the lines can not help us identify the digit.
● Feature Analysis using Feature Set #1
| Digit \Feature | Holes1* | Notches2 | H Line3 | V Line4 | W / H5^ | Digit / Area6^ | Hole / Area7^ | Notch / Area 8^ |
| 0 | 1 ( [0%], [100%], [0%]) |
4 [100%] | 0 [ 87.65%] 2 [12.35%] |
0 [56.36%] 2 [43.64%] |
0.5 [98.67%] 0.6 [66.67% ] |
0.3 [86.67%] 0.4 [68.78%] |
0.3 [86.76%] 0.4 [68.55%] |
0.1 [93.33%] 0.3 [0%] |
| 1 | 0 [100%] | 2 [46.67%] 3 [53.33%] |
1 [98.67%] | 1 [100%] | 0.3 [86.67%] 0.5 [23.33%] |
0.3 [80.00%] 0.4 [46.67%] |
n/a | 0.3 [98.67%] 0.5 [86.67%] |
| 2 | 0 [100%] | 3 [42.00%] 4 [31.33%] |
1 [90.67%] | 0 [97.33%] | 0.5 [96.67%] 0.6 [83.33%] |
0.3 [86.67%] 0.4 [43.00%] |
n/a | 0.3 [98.67%] 0.5 [85.33%] |
| 3 | 0 [100%] | 4 [62.67%] 5 [10.33%] 6 [27.00%] |
0 [74.00%] | 0 [86.67%] | 0.5 [100%] 0.6 [80.00%] |
0.3 [86.67%] 0.4 [47.67%] |
n/a | 0.3 [96.67%] 0.5 [86.67%] |
| 4 | 1 ( [47.33%], [53.67%], [0%]) |
4 [100%] | 1 [100%] | 1 [100%] | 0.5 [100%] 0.6 [93.33%] |
0.3 [82.67%] 0.4 [17.33%] |
0.1 [83.33%] 0.3 [0%] |
0.3 [93.33%] 0.5 [73.33%] |
| 5 | 0 [100%] | 4 [80.00%] 5 [19.67%] |
0 [84.00%] | 0 [100%] | 0.5 [100%] 0.6 [80.00%] |
0.3 [86.67%] 0.4 [53.33%] |
n/a | 0.3 [100%] 0.5 [86.67%] |
| 6 | 1 ([0%], [26.00%], [73.33%]) |
4 [73.33%] 5 [26.67%] |
0 [53.67%] 1 [26.67%] |
0 [73.33%] | 0.5 [100%] 0.6 [73.33%] |
0.3 [98.30%] 0.4 [76.92%] |
0.2 [80.00%] 0.3 [5.33%] |
0.2 [98.67%] 0.3 [56.33%] |
| 7 | 0 [100%] | 2 [70.00%] 3 [20.00%] 4 [10.00%] |
1 [99.33%] | 0 [90.00%] 1 [10.00%] |
0.5 [99.33%] 0.6 [83.33%] |
0.2 [93.33%] 0.3 [36.00%] |
n/a | 0.5 [90.00%] |
| 8 | 2 (1, 0, 1) [100%] |
4 [63.33%] 6 [36.67%] |
0 [63.33%] 1,2,3,4[36.67%] |
0 [83.33%] 2 [15.56%] |
0.5 [100%] 0.6 [56.67%] |
0.3 [96.00%] 0.4 [76%] |
0.3 [83.33%] | 0.1 [93.33%] 0.3 [0%] |
| 9 | 1 ([96.00%], [0%], [0%]) |
4 [60.00%] 5 [40.00%] |
0 [73.67%] 1,2,3[26.33%] |
0 [80.00%] 1 [20.00%] |
0.5 [100%] 0.6 [73.33%] |
0.3 [93.33%] 0.4 [73.33%] |
0.2 [88.00%] 0.3 [6.67%] |
0.2 [90.33%] 0.3 [56.67%] |
1 # of Holes (up,
center, down); 2 # of Notches;
3 # of Horizontal Lines
(longer than Ratio x Bounding Box Width);
4 # of Vertical Lines
(longer than Ratio x Bounding Box Height);
5 Bounding box Width/
Height;
6 # of Pixels of the digit
/ # of Pixels of the Bounding Box;
7 # of Pixels of the holes
/ # of Pixels of the Bounding Box;
8 # of Pixels of the
notches / # of Pixels of the Bounding Box.
Note: All the measures are calculated through the 150 training cases for each single digit. We have a total of 150 x 10 = 1,500 training digits. The ratio for the measure 4 and 5 is 0.9 in analysis. Percentage is given in "[ ]".
* in the parenthesizes, the hole
is showed with the format (up, center, down).
^ the percentages represent the ratio
that is greater than the number given in the front.
Remarks: The feature "Holes" is one of the most important features from our analysis above. The training set shows that all the 8's have two holes, and almost all the 4's, 6's, and 9's have one hole. We further measure the position of the hole using "up", "center", and "down" positions. The intuitive idea is to use the hole position to identify 0, 6, and 9, since 0 has a center hole, 6 is more likely to have a hole downward, and 9's hole is likely to be upward. However, we have to be careful about the 4 which may cause some confusion when classifying 0 or 9. Also, there are very small number of 6's and 9's having two holes with the addition hole being created in the middle of the join.
"H Line" and "V Line" are two other important features. 1 and 4 contain one h-line and one v-line. With the hole feature, we can classify 1 and 4 very accurately here. Other digits like 2 and 7 are very likely to have one h-line. We did not give the detailed results for each digits here but some percentage numbers. However, we notice that some font like "impact" appears like bold style which gives some unexpected h-line and v-line. Also, the italic font tends to eliminate some v-line which exists in the regular font.
"Notches" generally can not be applied to distinguish a digit well. 0 and 4 have four notches among all training cases. However, this can not be used to classify 0 and 4 since other digits are shown very likely to have four notches too.
The ratio measures can help with some specific cases. "W/H" ratio can be used to classify 1 and 7 since normally 7 should have a larger number under this ratio. "Hole/Area" ratio can help to identify 0 from 6 and 9 as 0 should have more pixels in the hole. "Notch/Area" ratio can be applied to classify 8 in addition to the number of hole feature. However, we find "Digit/Area" ratio is somehow disappointing which may not be useful at all.
We implement the digit classification schemes with two common classification methods first. We hope the two approaches can help us learn the behaviors of the different features on the typing digits.
☼ The Decision Tree Classification (DTC)
The most intuitive classification scheme is the DTC. We manually construct the DT based on the Feature Analysis in the above section. Our DT is shown in the Figure below.
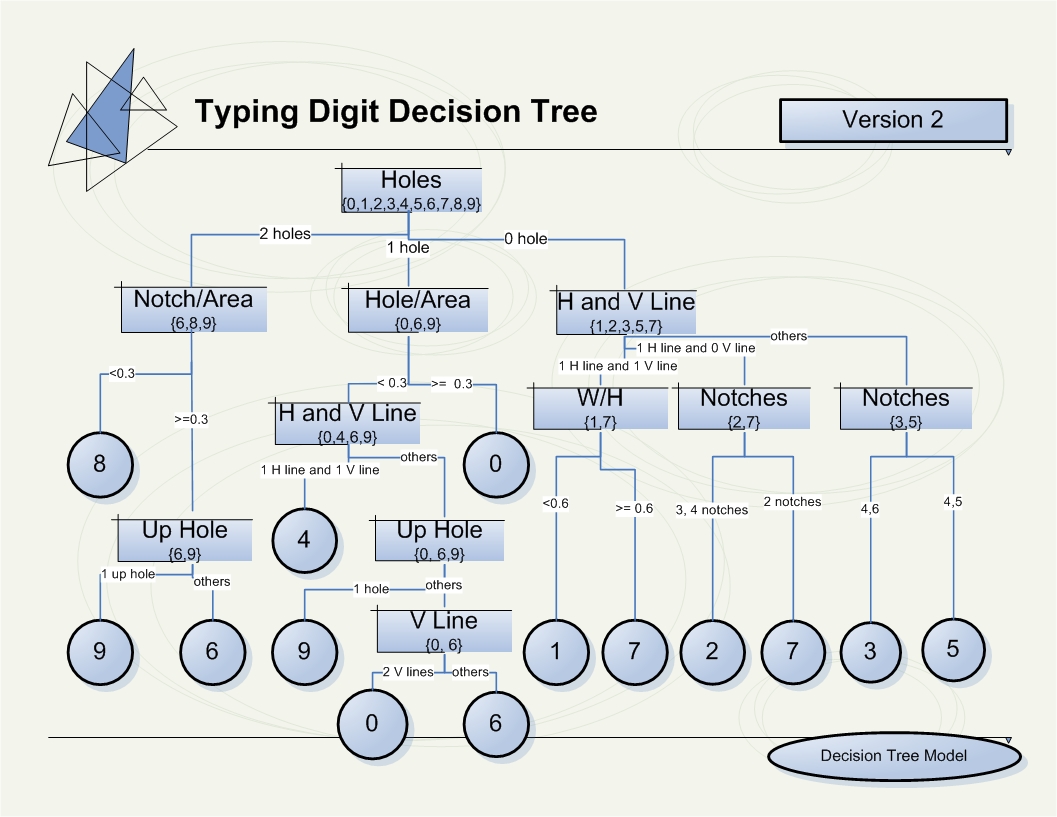 (Click
image for full size figure)
(Click
image for full size figure)
Remark: The DT we construct here is rooted at the number of holes measure. Clearly, this gives us three subsets of the ten digits. The two-hole subset is mainly classified to 8 with small probability of being 6 or 9. The one-hole subset can be further checked using the Hole/Area ratio since 0 is more likely to have a bigger hole area. The none-hole subset is where the DTC meets problems. In generally, distinguishing 2 from 7, and 3 from 5 are impossible to be very accurate with the features presented in the Feature Set #1. Thus, the DT is expected to make some mistakes when classifying 2, 3, 5, and 7.
☼ The Nearest Neighbor Classification (NNC)
Since the DTC already demonstrated the limitation of classification with Digit Feature Set #1, our NNC is based on a different template matching approach. The template library is a connection of digits with the value specified by the file name (i.e. Digit "4" is stored in the file named "4_lib.dat"). The classification is based on the comparisons between the input samples and the library samples. The prediction result is the digit sample value outputting the minimum distance.
In order to make the comparison between the input sample and the library sample more efficient, we preprocess the library samples to its {0,1} map representation as demonstrated in the Feature Extraction. There are 10 files in the library named "num_lib.dat" where num is a character from 0 to 9. Each file consists 15 samples separated by "#", and the samples are taken from five different fonts with the setting being Normal, Italic, or Bold. The original library digit image files and the extracted library sample files can be downloaded here. We intentionally made the library sample digit with a big font size such that the input testing sample should have a smaller size.
During the classification process, we first extract the input images into a set of digit samples with the {0,1} map representations. Then take a digit sample and normalize the library samples to the same height with the width being scaled by the same factor. Finally we compare the input sample with all the normalized library samples and find the library sample yielding the minimum distance of the input sample. The value of that library sample is returned as the predicted value of the input. The distance is measured by the difference of the black pixels (i.e. 0 in the map) in percentage against the total black pixels. At each comparison between an input sample and a library sample, we calculate the distance from the first to the latter, and also the distance from the latter to the first. The finally distance is the average of the two. Normalization (scaling) is done simply by taking every |1/f | pixel of the library sample, where f is the scaling factor. In this case, we avoid the image resampling.
☼ The Decision Tree Classification (DTC)
We use our testing set to test the DTC. The testing set consists of 15 digit image files and one character image file. There are 10 digit image files with each one containing 32 cases of a single digit. 2 digit image files are used to test digits with different fonts. 3 digit image files are just mixed digits and fonts together.
Our testing results are shown in the following two tables.
DTC Testing Result Table #1 (Single Digit)
| Digit | Total Testing Cases | Correct/Incorrect | Correct Rate | Confused Digit |
| 0 | 32 | 23 / 9 | 71.9% | All wrong classified to 6 |
| 1 | 32 | 25 / 7 | 78.19% | Mainly wrong classified to 7 |
| 2 | 32 | 14 / 18 | 43.8% | Mainly wrong classified to 3 or 5 |
| 3 | 32 | 14 / 18* | 43.8% | Mainly wrong classified to 5 or 7 |
| 4 | 32 | 30 / 2 | 93.8% | One wrong classified to 7, the other to 9 |
| 5 | 32 | 24 / 8* | 75.0% | Mainly wrong classified to 2 or 3 |
| 6 | 32 | 25 / 7 | 78.1% | Mainly wrong classified to 4 |
| 7 | 32 | 17 / 15 | 53.1% | Mainly wrong classified to 4 |
| 8 | 32 | 32 / 0 | 100.0% | All correct in testing cases |
| 9 | 32 | 22 / 10 | 68.8% | Mainly wrong classified to 4 |
* We set the random choice at {3,5} to favor 5 when testing.
DTC Testing Result Table #2 (Mixed Font and Character)
| Image File Des | Total # of Digit/Char | Correct Classified | Correct Rate |
Classification Comment |
| Mixed Digit 1 | 40 | 28 | 70.0% | Most of the misclassifications are among 2, 3, 5. 2 and 3 are classified to 5 in most cases. |
| Mixed Digit 2 | 40 | 25 | 62.5% | Bigger size font clearly helps the classification. However, the italic font causes the problems of misclassifying 0, 1, and 4. |
| Mixed Digit 3 | 32 | 20 | 62.5% | The same problem for the italic font. 0's notch area increases with the italic font, which causes the DTC to output 6. 7's bounding box ratio also changes with the italic font causing misclassification to 1. |
| Mixed Font 1 | 50 | 29 | 58.0% | Same problem as previous. |
| Mixed Font 2 | 50 | 32 | 64.0% | Small size digits are hard to classify here. Only 40% of the small size digits are correctly classified. |
| Character | 16 | 0 | 0% | The DTC generally cannot handle the characters. "O" is classified to digit 0, "q" is classified to digit 9, "a" is classified to digit 6, and "i" is read as two separated regions. |
☼ The Nearest Neighbor Classification (NNC)
We repeat the test which has been done with the DTC above here with the NNC. The results are demonstrated in a similar fashion to show the improvement below.
NNC Testing Result Table #3 (Single Digit)
| Digit | Total Testing Cases | Correct/Incorrect | Correct Rate | Confused Digit |
| 0 | 32 | 28 / 4 | 87.5% | Wrong classified to 8 |
| 1 | 32 | 32 / 0 | 100% | All correct |
| 2 | 32 | 31 / 1 | 96.9% | Wrong classified to 1 |
| 3 | 32 | 26 / 6 | 81.3% | Wrong classified to 5 |
| 4 | 32 | 32 / 0 | 100% | All correct |
| 5 | 32 | 32 / 0 | 100% | All correct |
| 6 | 32 | 29 / 3 | 90.6% | Wrong classified to 0 and 5 |
| 7 | 32 | 32 / 0 | 100% | All correct |
| 8 | 32 | 29 / 3 | 90.6% | Wrong classified to 6 and 0 |
| 9 | 32 | 32 / 0 | 100% | All correct |
NNC Testing Result Table #4 (Mixed Font and Character)
| Image File Des | Total # of Digit/Char | Correct Classified | Correct Rate |
Classification Comment |
| Mixed Digit 1 | 40 | 40 | 100% | All correct |
| Mixed Digit 2 | 40 | 39 | 97.5% | One italic 3 was classified to 8. |
| Mixed Digit 3 | 32 | 28 | 87.5% | Three 3's were classified to 8 and one 5 was classified to 6. |
| Mixed Font 1 | 50 | 44 | 88.0% | Mainly wrong misclassifications were on the italic small font digits. |
| Mixed Font 2 | 50 | 36 | 72.0% | Small size digits are hard to classify here. |
Since the NNC based on the template matching has showed some significant improvement in our "regular" testing. We further applied it (with the sample library) to a wild set of digits created through our program like demonstrated in the Sample Image. The set is also available here. The testing results are showed in following table.
| Font | Total # of Digit/Char | Correct Classified | Correct Rate |
Classification Comment |
| Algerian | 20 | 15 | 75% | The font is somehow "regular" with one side double edged. And the difficulty is to discriminate 6 and 8. |
| Berhard Fashion | 20 | 9 | 45% | The font is very thin, and 1, 2, 3, and 5 are very hard to be recognized. |
| French Script | 20 | 16 | 80% | The difficulty for this font is the feature extraction as the font is smaller than regular ones. |
| Joker man | 20 | 18 | 90% | The font has disjoint regions for a digit. The program actually returns more than 20 regions. However, if we manually discard the disjointed regions, the classification can be fairly accurate. |
| Viner Hand | 20 | 8 | 40% | The font is very similar to handwriting digits thus varies a lot in digit shape to regular fonts. The poor performance shows the incapability of applying this NNC to handwriting digit recognition. |
We discuss our classification results from different approaches that we have been applied here.
☼ The Decision Tree Classification (DTC)
Testing Result Table 1 and 2 show some results from applying our DTC to the testing digit and character images. The DT here is manually constructed through the studies on our training digit images. Thus, the DT is not optimal here to the testing set.
We notice that the features from Digit Feature Set #1 have some problems identifying 2, 3, and 5. In the single digit testing results, 2 and 3 are mainly misclassified. Because of this fundamental limit, the DTC can not efficiently distinguish 2, 3, and 5.
Also, our training images mainly consist digits that are not italic. So the later italic font in the testing images causes the misclassifications of 0, 4 and 7, which used to be classified with a high accuracy in the none italic font.
The DTC can be reconstructed though some different training set study later to include more italic font digits. However, this is expected to further limit our feature choices since some important features such as Notch/Area and W/H may not be useful anymore. Above all, we can conclude that this DTC based on some intuitive digit features can not give us very accurate classification results.
☼ The Nearest Neighbor Classification (NNC)
The NNC based on template matching works reasonably well on regular font digits. In most cases, the accurate rate of the recognition is above 85%. Even with some "wild" font, the NNC may still work with some extra work needed in the region finding. From the testing result in Table 3 and 4, the NNC clearly yields a significant improvement over the DTC above. The extra test samples with the "wild" fonts can not be applied to the DTC since the almost all intuitive features used by the DTC can not be implied to those samples. However, those samples somehow still reserve the basic digit shapes which may be classified by the NNC.
The NNC here is highly related with the chosen library. We tried to avoid the overfitting problem by limiting the samples in the library. In order to make our experiment consistent, the library is kept the same for all the tests. Of course, adding a set of digit samples (0 to 9) with a certain font to the library when classifying the digit sample with the same font should give us a better result. And ultimately, we can add all font digit sample sets into the library without caring the speed of the classification process to get the optimal classification result. But, obviously, this is an impractical library, and practical library can only contain certain amount of samples. In our experiment, we mainly concentrate on the classification methods, thus the library efficiency has not be studied.
The DTC has been showed incapable of discriminating characters. The NNC has the same problem but some distance threshold can be set to reject some characters. The threshold comes from the empirical results when doing digit classifications. It should be noticed that even with the distance threshold, there is still no guarantee to reject all characters for the reasons like character "O" has identical black pixels as digit "0" in the {0,1} map, or character "q" very likely to be recognized as digit "9".
We provide the classification program and source code (expect classifier class) here. Our training and testing dataset are also compressed for downloading.
Part 1: Classification Program (no source code on classifier classes)
Final Release (include source code, DTclassifier.java and NNclassifier.java are not included)
Part 2: Classification Data
Problem with using it, please refer to the Function Tutorial section, or mail Henry.
We would like to get feedback from you if you have any comment about this program. The best way to leave messages here is to mail Henry.
Thanks for your attention, and hope you have fun with the program.